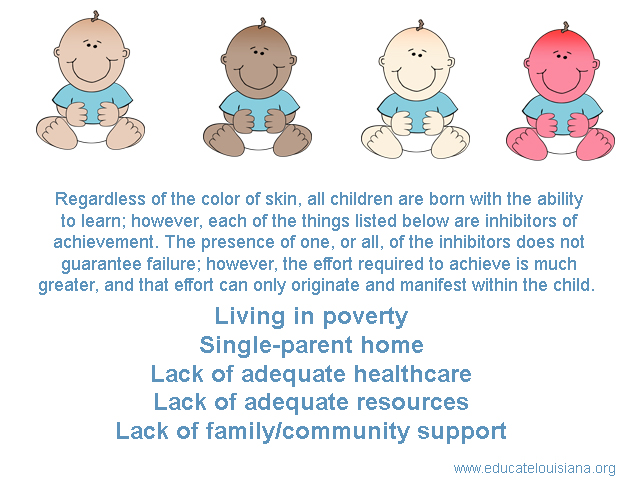
What do you think of when you hear the words “children living in poverty?” If you close your eyes, what would you imagine a room full of “children living in poverty” would look like? It turns out that in education, the faces of children living in poverty cover a very broad spectrum.
Since the birth of educational accountability, those employed in the field education have asserted that accountability doesn’t take into consideration the disadvantages of children living in poverty. Education reformers have decreed that this is nonsense. Their favorite retort is “every child can learn, regardless of zip code.” I can tell you, as a career educator with two master’s degrees in education, this is unequivocally, true. It is a fact that if you are unable to learn, you are either dead, or a vegetable.
I know. That sounds like a ridiculous statement, but in Louisiana education, we are often faced with ridiculousness. The idea that every child can learn is meaningless in Louisiana. Why? Because in Louisiana, we measure whether a child has mastered a standard; not the degree to which they have learned. If a child has not achieved a predetermined level of performance, they have failed. This, in no way, tells you whether, or not, a child has learned. To take that even further, the teacher is labeled a failure.
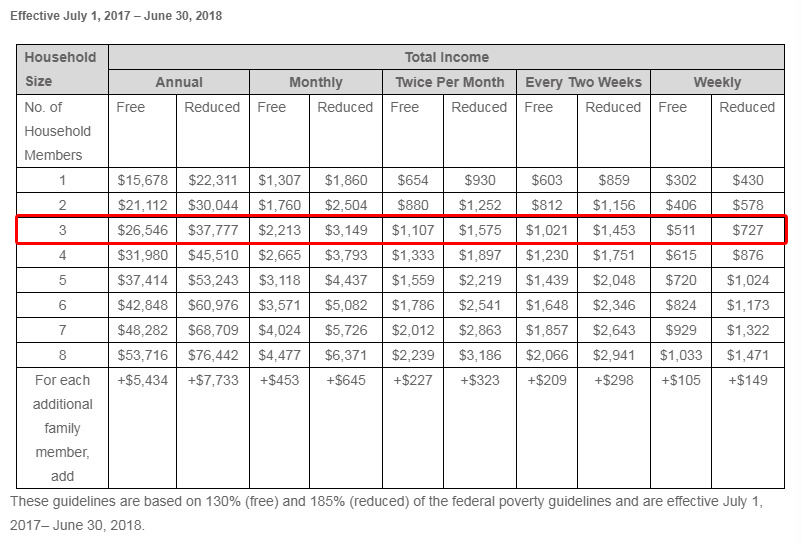
In education, we use a very generalized indicator to identify children living in poverty; free and reduced lunches. The free/reduced lunch program is based on a differential of the federal poverty level. In Louisiana that differential is 185%. For the purposes of this blog, let’s examine the requirements for a family of three in the chart below. In educational accountability, this chart tell us that a family of three earning $37,777 per year, or less, is considered living in poverty. Keep in mind, a family of three can be a single-parent with two children, or two parents with one child. That will matter, later.
The research available to support the claims that educational achievement is greatly affected by poverty is abundant, but it drills down much deeper than the very general “free/reduced lunch” assertion. Here are some links to some very informative articles.
- How does poverty affect education?-LSU
- How poverty affects classroom engagement.-ASCD
- Does poverty influence learning?-Edutopia
- 10 Facts About How Poverty Impacts Education-Scientific Learning
Each of the articles above include links to and/or references the basis of their assertion, and each author gears their article to serve their needs, but the basic agreement among the authors is that the following things affect achievement in the classroom when combined with poverty.
- Single-parent household: A child entering pre-k who is living in poverty in a single-parent home is more likely to be less cognitively developed, have a vocabulary half the size of their peers living in two-parent homes, underdeveloped executive function, and limited socio-emotional development.
- Lack of healthcare: Children who don’t have access to adequate healthcare suffer from chronic absenteeism, poor sleep habits, and may suffer from malnutrition if underlying health concerns aren’t addressed.
- Lack of resources: Children in poverty who don’t have adequate access to resources such as technology, transportation, and a family or community safety net are less likely to excel in achievement.
So, let’s take a look at what poverty looks like in Louisiana. The percentage of children in Louisiana who live in poverty is approximately 32%. That 32% is broken down by race or ethnicity in the graph below.
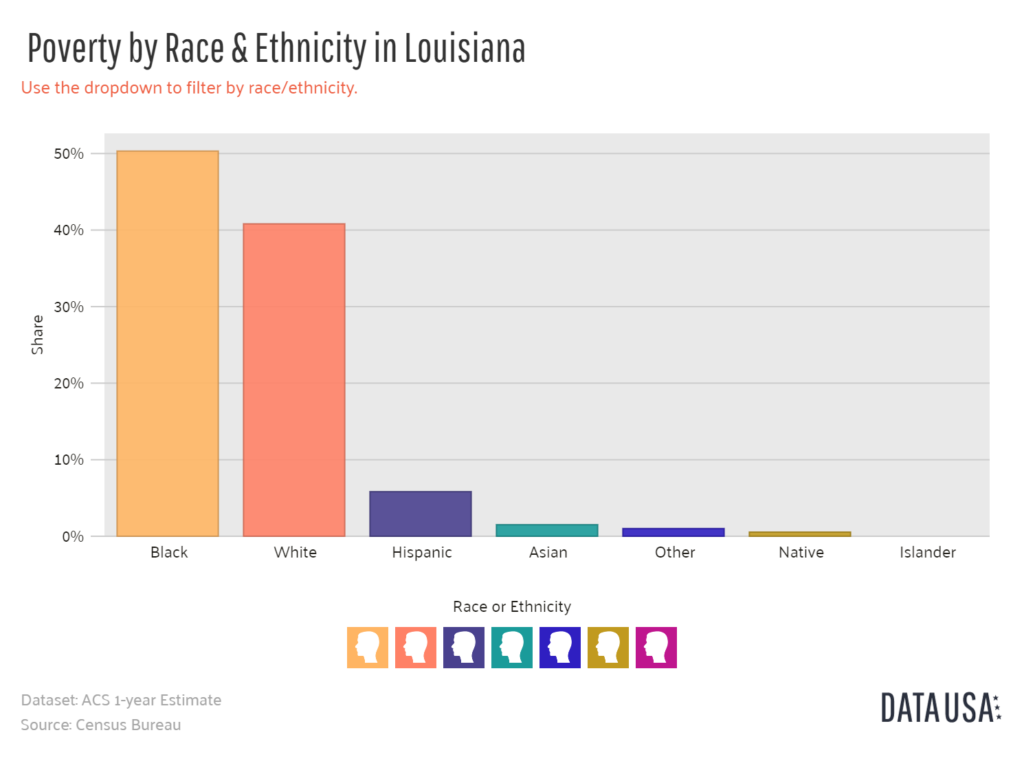
As shown above roughly 50% of the children living in poverty are African-American, 40% are white, and Hispanic, Asian, Native American, Islander, and other, make up the remaining 10%. What isn’t illustrated very well in the chart is that these figures aren’t evenly distributed across Louisiana. By that, I mean that in some areas, you might find white students in poverty are greater than African-American, or as in some places, Hispanic students in poverty outnumber both African-American and white. It really depends on your locale.
We also know that the percentage of students in single-parent homes is roughly 45%, but these are not necessarily the same subsets; meaning that there are many children in single-parent homes that are not living in poverty. You can see the break down in the chart below.
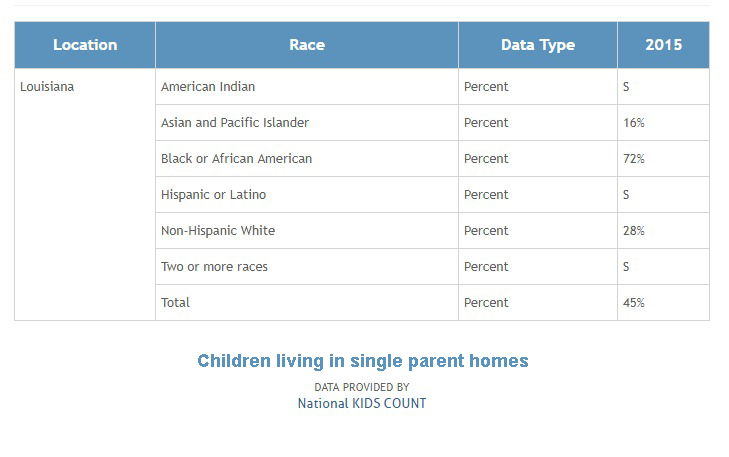
The two main things to take away from this chart, in comparison with the poverty chart shown above, 1) African-American children represent 72% of the children living in single-parent homes. 2) Hispanic children represent such a small number that it can’t be expressed. In recent years, the divorce rate in rural areas has closed in on the divorce rate in urban areas; however, the concentration of single mothers, who have never wed, is much greater in urban localities. With that said, regardless of the race/ethnicity, the greatest portion of single-parent homes is in urban areas. We also know that relatively few Hispanic children live in single-parent homes, regardless of locale. Add to that, Hispanics possess a sense of family, culture and community that surpasses all other ethnic demographics. The National Center for Educational Statistics asserts that Hispanic students typically perform better on achievement tests than their African-American counterparts. This could explain the high-performing/high-poverty schools in the Metairie area. Many of the schools in Metairie, under the governance of the Jefferson Parish School Board, have an unusually high percentage of Hispanics. One school; in excess of 65%.
According to the Louisiana Department of Health Services, there are 475,000 low-income children currently enrolled in Medicaid. That isn’t to say that all of the children enrolled actually have access to healthcare. In many cases, there are still copay and deductible to be met, and if you are a family living at the actual poverty rate (not 185%) it might be difficult to pay those. This is common even in middle-class families such as mine. I often delay, or avoid, surgery and tests even though I am fully insured, because I simply can’t afford the deductible and copay. Children in this position are more likely to be found in urban areas.
So what is the takeaway to all of this data? First, poverty is not an accurate indicator of educational achievement. There are too many other factors. For example, the children of a single mother living in poverty in an urban area have a much steeper hill to climb than the children with two parents living in poverty in a rural area. The statistics are there and can’t be denied. These statistics are not reflected in school performance scores (SPS). If they were, the differences from class to class, school to school and parish to parish would be seen, and the practice of judging both students and teachers, across the board, by a single achievement test would be revealed to be the sham that it is.