

It has been some time since I’ve posted a blog. I’m about three quarters of the way through summer break, and I’ve spent the majority of it addressing some long neglected personal health issues with only occasional political sparring with a handful of good friends. The last blog that I published was on June 2nd about a bill pass by Senator Dan Morrish requiring that anytime BESE changes the method of calculating school scores they must produce school report cards showing the score using both the old and new formulas. That blog was titled, High Impact Assessments. As luck would have it, this blog is about the same topic.
Last Tuesday, July 10th, the Louisiana Department of Education (LDOE) released the results of the Spring 2018 LEAP test results. Of course, these results don’t show individual student performance, nor do they reflect school scores. These are the figures that tell us what percentage of students scored Advanced, Mastery, Basic, Approaching Basic, and Unsatisfactory. They will also be used to calculate school scores.
On the morning of July 10th, I received an email from LDOE containing the press release regarding the results. I opened it, but didn’t really read much of it. That evening, I attended my local school board meeting (Calcasieu) where Supt. Karl Bruchhaus reported the district results to the board members. He reported a nominal increase in the number of students scoring mastery and added that they were “cautiously optimistic” about scores coming out in the Fall, but it was a welcome improvement. By the time I got home, several superintendents that I follow on Twitter and Facebook had reported similar results. After reading the press release from LDOE, I realized that the same message was pushed out to all of the districts. My immediate thought was, provided the results are accurate, this will be justification for the continued use of the poorly designed Tier 1 curricula being forced into districts despite public outcry and push back from teachers.
Toward the end of the week, I had lunch with a friend who is planning to run for school board. We discussed a variety of things, but inevitably the conversation turned to budgets and test scores. As we were about to part ways, my friend told me that he will never forget something a mentor told him years ago. He said, “figures don’t lie, but people who figure figures, do.”
I immediately recognized what he said as a variation of a quote accredited to Samuel Clemens. Albert Einstein also made a highly recognizable quote related to statistics. The two quotes are among my favorites.
- Figures don’t lie, but liars figure. (Clemens)
- There are lies. There are damn lies. And then, there are statistics. (Einstein)
Now, if you read the last blog, which I linked to above, you understand why it is so important that Sen. Morrish’s bill was passed. The manner in which school scores will be calculated will drastically affect the outcome of the scores. It is expected that a large number of schools rated A will drop to B, or even C. On the flip side, there will be an increase in the number of schools rated F.
The data released doesn’t provide enough information to accurately calculate school scores; however, you can compare it with the same report released in 2017 and glean enough information to make a reasonable prediction of the outcome. Let’s start by looking at the key difference in scoring.
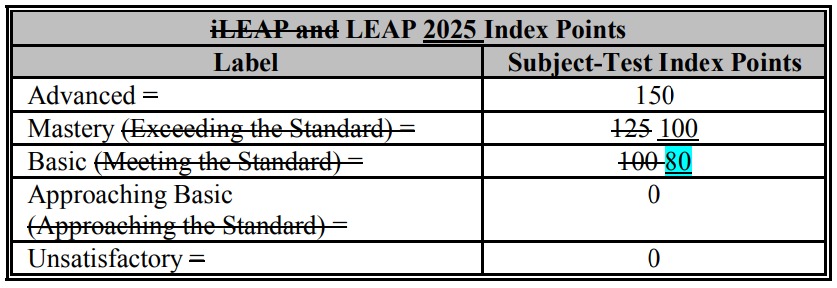
In the graphic shown above, you see the points that a school is awarded depending on the achievement of a student. For each student who scores “Advanced,” the school will receive 150 points. That is unchanged from 2017. For each student who scores “Mastery,” the school receives 100 points which is a 20% reduction in points from 2017. Likewise, for each student scoring “Basic,” the school receives 80 points which is also a 20% reduction.
As you can see, it would take a 25% increase in both Mastery and Basic to make up for the points lost in the 20% reduction. In the case of Calcasieu, the modest 3% increase in students scoring Mastery won’t cut it. I thought it would be fun to parse out the data and try to predict a district score. Remember, I make no claim to statistical accuracy. There isn’t enough information, but you can follow my logic, and I think you will agree with my finding.
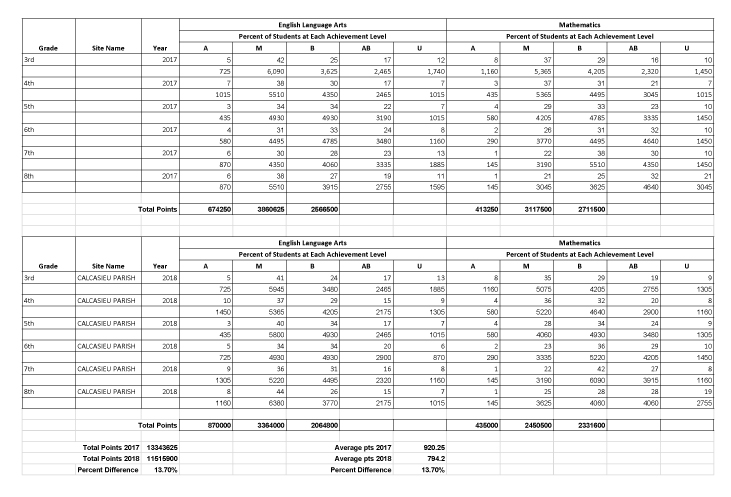
Using the achievement distribution for 3rd-8th, only ELA and Math, I made the following calculations based on Calcasieu testing approximately 14,500 students. First, I calculated the points earned for each achievement level, then totaled the points for each year. I also calculated an average of “points per student.” Using the final calculations, which can be seen at the bottom of the chart, I determined a 13.7% drop in the total points earned.
Although school scores are determined by a few other things in addition to test scores, the bulk of the score comes from testing. It is safe to assume that applying this reduction to Calcasieu’s 2017 SPS score would provide a reasonably predicted score. In 2017, Calcasieu’s SPS score was 84.8 which translates to a C score. If you reduce that score by 13.7%, you get 72.9. My immediate reaction was, “Wow! That’s gonna drop the district to a mid-level D. Well, I was wrong. Using the new grading scale approved by BESE at the same time it approved the achievement points, I found that a 72.9 is still a C.
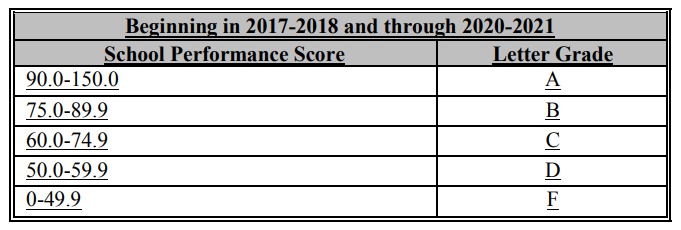
You may have noticed that using the “new” scoring scale, Calcasieu’s 84.8, last year, would have been a B. It makes you wonder how Calcasieu could maintain a C rating given a modest 3% increase in Mastery and a 20% reduction in points in 2 of 3 achievement levels AND a different scoring scale? Here are a few things to consider.
- There was already tremendous push back from the governor’s office, school boards, unions, superintendents, and others, related to the rigid changes in achievement points and scoring.
- A bill requiring both the old score and new score on school report cards would put the scores side by side and trigger a public outcry.
- Regardless of how tests are scored, and school scores are calculation, excepting any irregularities, schools and districts generally perform at approximately the same level in relation to each other.
- Despite validity requiring cut scores to be set BEFORE a test is administered, BESE regularly approves cut scores AFTER raw scores are returned.
This is my guess. In an effort to minimize the noise from public outcry when the scores come out, Supt. White adjusted the cut scores to soften the blow. It would certainly explain the increase in students achieving Mastery all across the state, or maybe that’s because we all have high quality curriculum, now. You tell me.

Perfect example of “figures don’t lie, but liars figure.” I think your conjecture is correct — the cut scores are constantly manipulated and it’s all meaningless.
In the practice of developing assessments, cut scores should be determined and agreed upon before the assessment is given. This is why there was contention with PARCC. White chose a different cut score AFTER the test was administered. Here is an example I gave on a Facebook post made by Senator Beth Mizell.
It is important to understand that these scores are completely arbitrary. Each year the expected level of performance changes and the minimum acceptable performance is determined by the superintendent AFTER raw scores are received. Even if expected level of performance is fixated, it isn’t reliable unless the minimum performance level is determined BEFORE testing and remains consistent. For example, if a coach needs to select 50 players for his team out of 300 athletes who tried out, he might publicize that to be selected, the athlete must be able to run a mile under 5 minutes knowing that he may have to fudge that number to get 50 players. If only 40 athletes meet the requirement, he has to adjust the requirement to maybe 5 minutes, 30 seconds, to get to 50. This is the same thing happening each year to make it appear that the results are comparable from year to year. In addition, the numbers cited by Beth Sherman Mizell are actually an improvement over last year. Each and every district is currently touting this fact; however, the manner in which school scores will be calculated has been dramatically changed, and when the school scores come out in the Fall, most schools will have lower scores despite an increase in the number of students meeting mastery. This is why it was so important that Senator Morrish’s bill passed which requires LDOE to report school scores using both the new method and the old.
Meanwhile they are bragging about a 2% increase when the bottom line is 60-75% of the students are not performing at grade level. This level of non education should be criminal.
You must also understand that the claim that 60%-75% of students are not performing at grade level is no more valid than the horn tooting they are doing about the validity of assessments and the progress, or lack of progress, being made. Who determines what is grade level? I can assure you the grade level represented in assessment has zero similarity to what researchers believe to be grade level.